Intelligence Dashboard: REE Export Restrictions Impact
Sterling Insight Group | Strategic Energy & Infrastructure Intelligence
Date: July 25, 2025
Dashboard Purpose
Provide executives and strategic planners with a real-time, at-a-glance situational overview of the evolving rare earth element (REE) supply risk posed by Chinese export restrictions. The dashboard consolidates key indicators, risk levels, supply chain status, and actionable intelligence to support rapid assessment and decision-making.
Dashboard Components
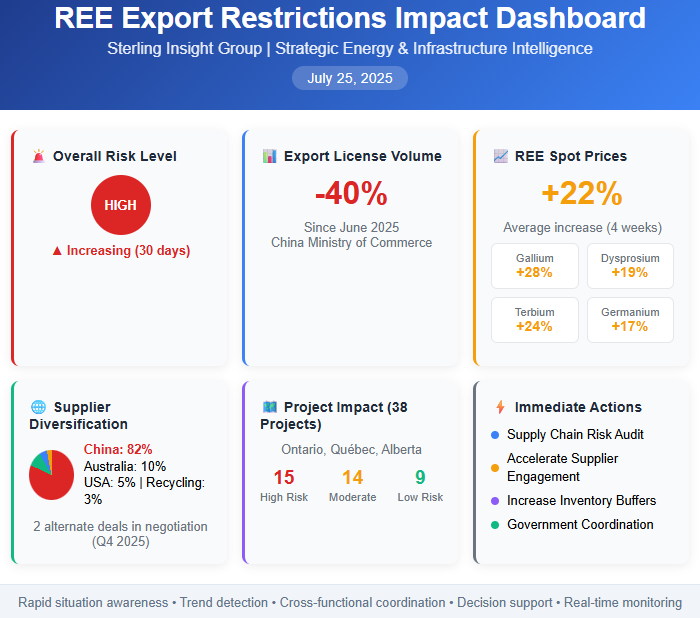
1. Risk Level Indicator (Top-Left)
Overall Risk: 🔴 High (Severe Supply Chain Disruption Expected)
Trend: ▲ Increasing over last 30 days due to new export restrictions and price spikes
Visual:
A large red dial or gauge moving from Green (Low) → Yellow (Medium) → Red (High)
2. Export License Volume Trend (Top-Right Chart)
Data Source: China Ministry of Commerce (monthly updates)
Metric: Volume of REE export licenses issued
Status: Sharp 40% drop since June 2025
Visual:
Line graph showing a steep decline in export licenses over the past 3 months.
3. REE Spot Price Index (Center-Left)
Commodities: Gallium, Dysprosium, Terbium, Germanium
Price Movement: +22% average increase in last 4 weeks
Market: Shanghai Metals Market & London Metal Exchange
Visual:
Multi-line chart tracking prices for key REEs with price % change annotations.
4. Project Impact Heatmap (Center-Right)
Coverage: 38 Renewable Energy Projects in Ontario, Québec, Alberta
Status Categories:
Red: High risk of delay due to REE shortage
Yellow: Moderate risk; supply chain resilient but vulnerable
Green: Low risk; alternative sourcing secured
Visual:
Geographic map overlay with color-coded project markers by risk level.
5. Supplier Diversification Status (Bottom-Left)
Current Dependency:
82% China-based REE supply
10% Australia, 5% USA, 3% Recycling efforts
Alternate Supply Deals: 2 in negotiation (expected Q4 2025)
Visual:
Pie chart showing current supplier share; progress bars for negotiation status.
6. Recommended Immediate Actions (Sidebar)
Conduct Supply Chain Risk Audit — In Progress
Accelerate Alternate Supplier Engagement — Next Step
Increase Project Inventory Buffers — Planning Stage
Government Coordination for Funding — Underway
Dashboard Benefits
Rapid Situation Awareness: Clear visualization of complex metrics reduces cognitive overload.
Trend Detection: Early spotting of worsening conditions enables proactive management.
Cross-Functional Coordination: Shared platform for procurement, strategy, and leadership teams.
Decision Support: Actionable insights highlighted with status and next steps.
Scenario Monitoring: Facilitates dynamic adjustment as data updates in near real-time.